Archive
Belmont JV Partner Marquee Resources Provides Complete Sampling Results - Kibby Basin Lithium Project
 | |||||||||
HIGHLIGHTS:
-
The Company has now received the final samples from the Kibby Basin Lithium Project with the results from two boreholes (KB 22-01 and KB 22-02) confirming high levels of lithium-bearing sediments along with dissolved lithium in the groundwater.
➢ Mineralised intervals containing up to 924 ppm lithium with greater than 300 ppm lithium over thicknesses in excess of 450m (1475 ft) have been identified in core samples of clay-rich playa sediments.
-
Lithium mineralisation is fairly consistent in both thickness and grade in the two boreholes, which are 2000 m apart, suggesting extensive lateral occurrence across the basin.
-
Drill hole KB 22-01
-
-
Assay results of drill core returned lithium solids concentrations of up to 924 ppm Li with mineralisation open at depth.
-
-
-
Below the contact between unconsolidated lakebed sediments and more lithified sediments, lithium content increased significantly and drilling intersected a 79 m (260 ft) thick section from 362-441 m (1188-1448 ft) averaging 771 ppm Li with a high of 924 ppm Li
-
-
-
The upper high lithium zone was contained within a very thick zone, averaging 383 ppm Li over 487 m (1597 ft) continuing to the bottom of the hole. The lithium mineralisation is open at depth.
-
-
Drill hole KB 22-02
-
-
Encountered anomalous lithium values above the hard gravel and significant lithium enrichment below with mineralisation remaining open at depth.
-
-
-
A thick zone of 169 m (555 ft) averaging 558 ppm Li with a high of 860 Li lay below the contact.
-
-
-
Lithium mineralisation continued to the bottom of the hole with an average of 379 ppm Li over 451m (1478 ft) continuing to the bottom of the hole. The lithium mineralisation is open at depth.
-
-
-
Dissolved lithium was identified in the groundwater at depths generally correlating with the lithium bearing sediments.
-
-
Following these significant results, Marquee has commenced planning for a 2023 exploration program at the Project
Vancouver, B.C. Canada, January 26, 2022; Belmont Resources Inc. (“Belmont”), (or the “Company”), (TSX.V: BEA; FSE: L3L2) is pleased to announce that Belmont’s JV partner Marquee Resources (ASX: MQR) (“Marquee”) announced the final results from its Kibby Basin Lithium Project 2022 drill campaign. Assay results received indicated thick sequences of lithium- bearing sediments at the Project, with up to 924 ppm Li from the two exploration boreholes (KB 22-01 and KB 22-02) that were completed.
George Sookochoff, President & CEO commented, “What is notable in the Kibby results from the first two holes drilled; Mineralised intervals containing up to 924 ppm lithium with greater than 300 ppm lithium over thicknesses in excess of 450m and fairly consistent Lithium mineralisation in both thickness and grade in the two boreholes, which are 2,000 m apart, suggesting extensive lateral occurrence across the basin. Belmont is looking forward to Marquee continuing in 2023.”
Core Assay Results
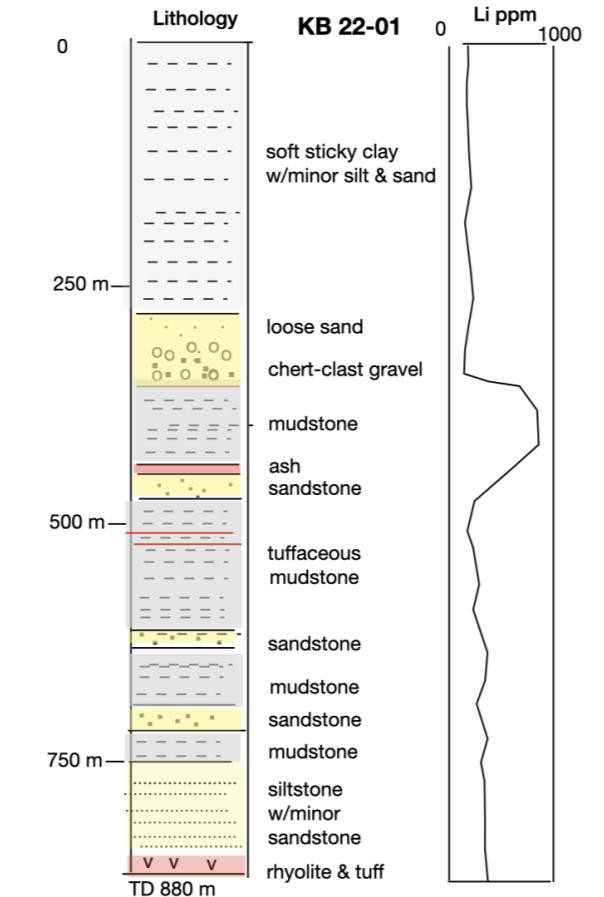
Hole KB 22-01 was drilled as a vertical borehole to a depth of 880 m (2888 ft). The hole was drilled as an air-core pre-collar to a depth of 329 (1080 ft), followed by HQ core, reduced to NQ core at 408 m (1338 ft).
As expected, analysis of cuttings from the upper non-core section of the hole indicated weakly anomalous lithium content, ranging from a few 10s of ppm to 154 ppm Li. Drilling switched to core immediately below a hard gravel unit, which forms the boundary between unconsolidated pluvial-fluvial sediments and partially lithified equivalents with substantial tuffaceous (ash) content below. A representative sampling of approximately 10% of the core was split in half using a diamond saw and one split was delivered to Paragon Geochemical in Sparks, NV, an ISO/IEC 17025-2017 certified laboratory, for 31-element ICP analysis, including lithium.
Lithium content increased significantly below the contact, with a 79 m (260 ft)-thick section from 362-441 m (1188-1448 ft) averaging 771 ppm Li with a high of 924 ppm Li. The upper high lithium zone was contained within a very thick zone, averaging 383 ppm Li over 487 m (1597 ft) continuing to the bottom of the hole. The lithium mineralisation is open at depth.
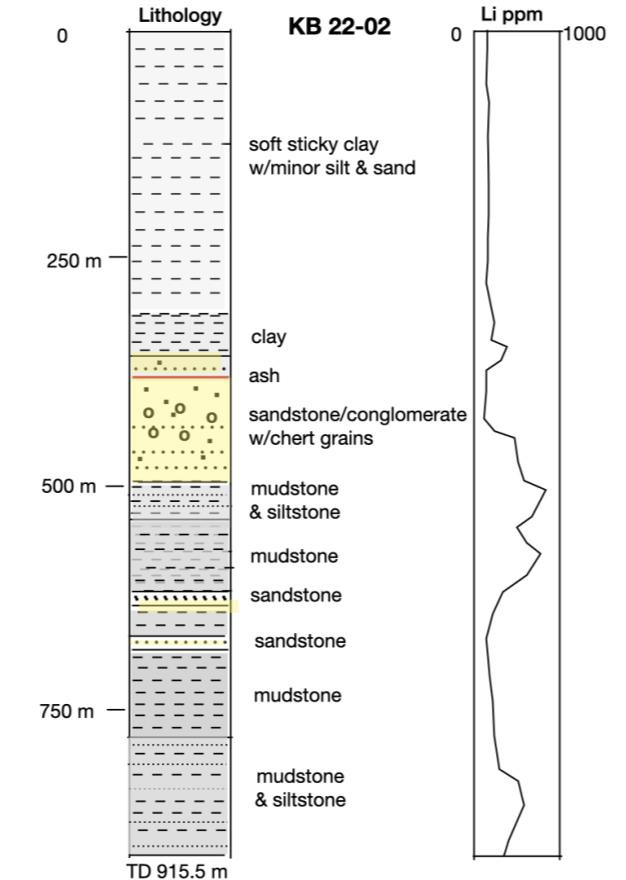
Hole KB 22-02 was drilled as a vertical borehole to a depth of 915.6 m (3004 ft). Similar to the first hole, KB 22-02 was drilled as a mud-rotary pre-collar to a depth of 365 m (1198 ft), followed by HQ and NQ core.
As with the first hole, KB 22-02 encountered anomalous lithium values above the hard gravel and significant lithium enrichment below. A 169 m (555 ft)-thick zone averaging 558 ppm Li with a high of 860 Li lay below the contact. Lithium mineralisation continued to the bottom of the hole with an average of 379 ppm Li over an interval of 451 m (1478 ft). Mineralisation remains open at depth.
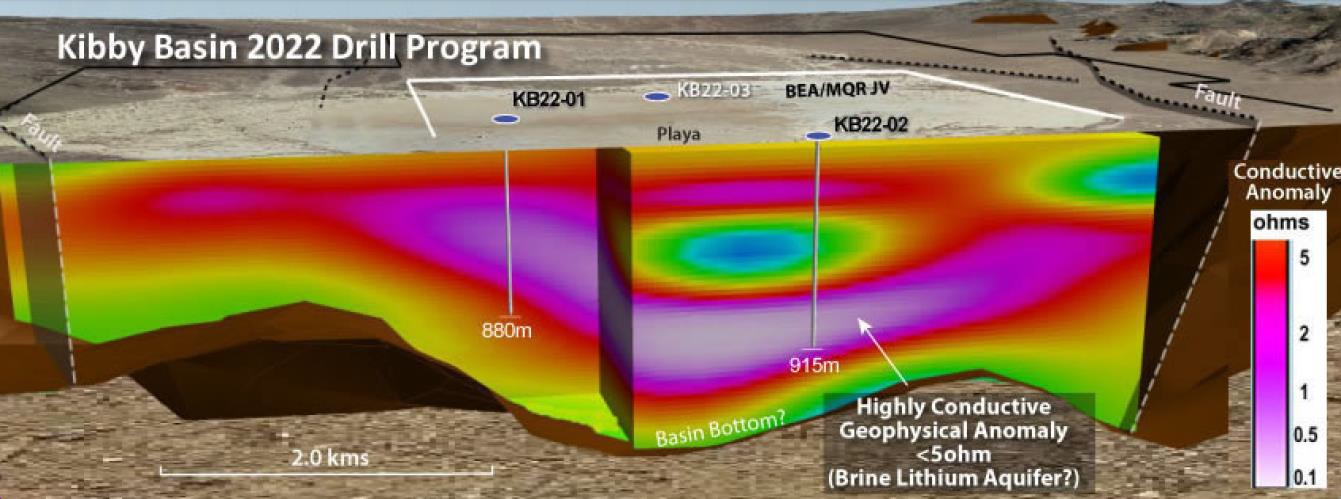
Both KB 22-01 and KB 22-02 were drilled to test a thick MT conductor. The start of the high lithium zone in both holes corresponds with the approximate top of the conductor. Neither hole drilled to the bottom of the conductor or the bottom of the potential aquifer zone within the playa-filling sediments.
The results of the core sampling are presented in Table 1.
Hole KB 22-01 was sampled for lithium-bearing groundwater in the pre-collar interval to a depth of 305 m (1000 ft), and the HQ and NQ core intervals to 853 m (2797 ft). Twenty-three intervals were sampled including two long interval, large purge-volume samples and a duplicate for quality assurance. Sample intervals were purged of drilling fluids and drill cuttings prior to sampling. A multiparameter chemistry meter was used to periodically monitor the purge water general chemistry and ensure formation groundwater was sampled. The general chemical parameters of water samples were also measured at the time of sample collection.
Samples were sent to a laboratory where they were analysed for a wide range of total and dissolved metals (including Lithium), anions, and general parameters. The total metals analysis provided a cumulative assay of both the soluble (dissolved) and particulate concentration of Lithium, and other metals, in the sampled water. The dissolved metals analysis reported only the soluble metals in solution.
Groundwater samples from twelve intervals of the upper pre-collar section of the hole were collected by means of airlifting groundwater from a short interval of exposed borehole. The pre-collar hole samples were delivered to ALS Geochemistry in Reno, NV, an ISO 45001-2018 certified laboratory, for 53-element trace element ICP analysis of dissolved metals. The trace element analysis is suitable for water with a low total dissolved solids (TDS) content (< 1%) and has a lithium detection limit of 0.1 μg/L.
Eleven samples from the HQ and NQ core hole below 343 m (1124 ft) were sampled with a large-volume bailer lowered to targeted depths. The core hole samples were delivered to Western Environmental Testing Laboratories (WETLAB) in Sparks, NV, a Nevada Division of Environmental Protection accredited laboratory, for 34-element ICP analysis, select anion by Ion Chromatography, and general chemistry analyses. This standard ICP analysis is suitable for elevated TDS water and has a laboratory detection limit for lithium of 0.1 mg/L and a practical quantitation limit of 2.0 mg/L. Standard ICP method lithium results below 2.0 mg/L should be considered an estimate.
ALS results from the pre-collar upper portion of the hole indicated dissolved lithium content up to 0.15 mg/L. The lithium content increased in the deeper HQ and NQ intervals of the hole. Total and dissolved lithium content peaked at 0.7 mg/L and 0.4 mg/L, respectively, at a depth of 407.8 – 410.9 m (1338 – 1348 ft). This zone correlated with high lithium content identified in the core assays.
Hole KB 22-02 was sampled for lithium bearing groundwater in the HQ and NQ intervals from 365 m (1198 ft) to
915.6 m (3004 ft). Twenty-nine samples were collected and analysed: including samples from overlapping zones and a long interval, large purge volume sample. As in the previous hole, each interval was purged of drilling fluids and cuttings prior to sampling. A multiparameter chemistry meter was used to periodically monitor the purge water general chemistry and ensure formation groundwater was sampled. The general chemical parameters of sample water were also measured at the time of sample collection. Groundwater samples were sent to WETLAB for 34-element ICP analysis of total and dissolved metals, select anion by Ion Chromatography, and general chemistry parameters.
The lower portion of KB 22-02 below 817 m (2682 ft) drilled through relatively competent formation material and was sampled by means of a straddle packer system across three intervals. The higher intervals of the borehole were drilled through formation materials unsuitable for packer testing. Twenty-four samples in this higher zone were collected using a large-volume bailer lowered to targeted depths following core hole purging. The remaining two samples were of purge water with anomalous chemistry readings.
Total lithium content increased exponentially with depth to a peak of 27 mg/L at 549 m (1800 ft). Multiple water samples confirmed elevated total lithium content across the zone from about 518 to 564 m (1700 to 1850 ft). This zone roughly correlated with high lithium content identified in the core assays.
Elevated lithium content occurred in two samples (Table 3: No. 25 and No. 26) of purge water recovered from a depth of about 762 m (2500 ft). However, other water samples collected from overlapping zones after purging (Table 3: No. 22 and No. 24) did not indicate the same elevated lithium content.
The summarised final results of the water sampling from KB 22-01 and KB 22-02 are presented in Table 2 and Table 3, respectively.
Click Image To View Full Size
Figure 1 – Kibby Basin Drill Program
Click Image To View Full Size
Click Image To View Full Size
Figure 2 - Lithology Logs
Table 1 -
|
KB 22-01 - 430313m E, 4243652m N NAD 83, vertical hole, TD 880.2 m |
KB 22-02 - 431950m E, 4242630m N, vertical hole, TD 915.6m |
|
Sample |
Sample |
||||||
|
From (m) |
To (m) |
length (m) |
Li ppm |
From (m) |
To (m) |
length (m) |
Li ppm |
| 0 |
6.1 |
6.1 |
70 |
||||
|
6.1 |
12.2 |
6.1 |
80 |
||||
|
12.2 |
18.3 |
6.1 |
80 |
||||
|
18.3 |
24.4 |
6.1 |
80 |
||||
|
24.4 |
30.5 |
6.1 |
80 |
||||
|
30.5 |
36.6 |
6.1 |
100 |
||||
|
36.6 |
42.7 |
6.1 |
100 |
||||
|
42.7 |
48.8 |
6.1 |
140 |
||||
|
48.8 |
54.9 |
6.1 |
110 |
0.0 |
0.0 |
0.0 |
65 |
|
54.9 |
61 |
6.1 |
100 |
0.0 |
0.0 |
0.0 |
65 |
|
61 |
67.1 |
6.1 |
90 |
0.0 |
0.0 |
0.0 |
75 |
|
67.1 |
73.2 |
6.1 |
80 |
0.0 |
0.0 |
0.0 |
96 |
|
73.2 |
79.3 |
6.1 |
40 |
0.0 |
0.0 |
0.0 |
110 |
|
79.3 |
85.4 |
6.1 |
100 |
0.0 |
0.0 |
0.0 |
136 |
|
85.4 |
91.5 |
6.1 |
90 |
0.0 |
0.0 |
0.0 |
144 |
|
103.6 |
109.7 |
6.1 |
143 |
0.0 |
0.0 |
0.0 |
119 |
|
134.1 |
140.2 |
6.1 |
122 |
0.0 |
0.0 |
0.0 |
135 |
|
164.6 |
170.7 |
6.1 |
132 |
0.0 |
0.0 |
0.0 |
130 |
|
237.7 |
243.8 |
6.1 |
141 |
0.0 |
0.0 |
0.0 |
106 |
|
298.7 |
304.8 |
6.1 |
154 |
0.0 |
0.0 |
0.0 |
161 |
|
317.0 |
323.1 |
6.1 |
64 |
0.0 |
0.0 |
0.0 |
165 |
|
317.0 |
323.1 |
6.1 |
53 |
0.0 |
139 |
||
|
cuttings |
cuttings |
||||||
|
core |
core |
||||||
|
362.1 |
364.2 |
2.1 |
682 |
365.7 |
368.2 |
2.4 |
318 |
|
408.3 |
413.4 |
5.1 |
810 |
380.4 |
383.1 |
2.7 |
90 |
|
413.8 |
416.9 |
3.1 |
924 |
415.4 |
418.5 |
3.0 |
105 |
|
438.1 |
441.3 |
3.2 |
917 |
427.9 |
430.7 |
2.7 |
108 |
|
471.7 |
474.9 |
3.2 |
523 |
462.7 |
465.7 |
3.0 |
494 |
|
505.2 |
508.4 |
3.2 |
151 |
496.2 |
499.2 |
3.0 |
510 |
|
529.6 |
532.8 |
3.2 |
103 |
525.4 |
527.6 |
2.1 |
860 |
|
564.9 |
571.2 |
6.3 |
186 |
555.0 |
558.1 |
3.0 |
539 |
|
587.4 |
590.7 |
3.3 |
219 |
586.1 |
587.6 |
1.5 |
768 |
|
636.2 |
639.4 |
3.2 |
202 |
629.1 |
631.8 |
2.7 |
345 |
|
684.6 |
687.9 |
3.3 |
362 |
647.7 |
650.7 |
3.0 |
138 |
|
663.8 |
666.9 |
3.1 |
251 |
678.8 |
681.0 |
2.3 |
89 |
|
684.9 |
687.9 |
3.0 |
255 |
708.6 |
710.8 |
2.1 |
144 |
|
770.3 |
773.5 |
3.2 |
356 |
751.9 |
755.0 |
3.0 |
192 |
|
753.7 |
755.9 |
2.2 |
115 |
772.3 |
775.1 |
2.7 |
188 |
|
770.5 |
773.5 |
3.0 |
294 |
809.2 |
812.3 |
3.1 |
200 |
|
813.2 |
815.6 |
3.1 |
296 |
833.0 |
836 |
3.0 |
411 |
|
849.7 |
852.8 |
3.0 |
324 |
868.9 |
872 |
3.1.0 |
501 |
|
873.2 |
876.3 |
3.1 |
311 |
910.1 |
913.1 |
3.0 |
312 |
Table 2 –
|
Sample No. |
Depth (m) |
Specific Conductivity |
Total Dissolved Solids |
Lithium - Dissolved |
Lithium - Total |
|
|
From |
To |
(μS/cm) |
(mg/L) |
(mg/L) |
(mg/L) |
|
|
KB22-01 No. 1 |
89.9 |
91.4 |
3200 |
2530 |
0.040 |
NA |
|
KB22-01 No. 2 |
108.2 |
109.7 |
4780 |
3110 |
0.055 |
NA |
|
KB22-01 No. 3 |
120.4 |
121.9 |
1330 |
860 |
0.102 |
NA |
|
KB22-01 No. 4 |
126.5 |
128.0 |
1370 |
3440 |
0.059 |
NA |
|
KB22-01 No. 5 |
138.7 |
140.2 |
2390 |
1540 |
0.075 |
NA |
|
KB22-01 No. 6 |
150.9 |
152.4 |
5580 |
3620 |
0.061 |
NA |
|
KB22-01 No. 7 |
169.2 |
170.7 |
6410 |
4150 |
0.068 |
NA |
|
KB22-01 No. 8 |
207.3 |
208.8 |
1590 |
1030 |
0.150 |
NA |
|
KB22-01 No. 9 |
224.0 |
230.1 |
2450 |
1590 |
0.128 |
NA |
|
KB22-01 No. 10 |
249.9 |
256.0 |
2320 |
1510 |
0.079 |
NA |
|
KB22-01 No. 11 |
268.2 |
274.3 |
2730 |
1780 |
0.078 |
NA |
|
KB22-01 No. 12 |
298.7 |
304.8 |
1090 |
710 |
0.056 |
NA |
|
KB22-01 No. 13 |
342.6 |
345.6 |
2254 |
1830 |
0.2 |
0.5 |
|
KB22-01 No. 14 |
342.6 |
880.3 |
2165 |
1850 |
0.2 |
0.2 |
|
KB22-01 No. 15 |
363.9 |
367.0 |
2005 |
1570 |
0.1 |
0.3 |
|
KB22-01 No. 16 |
407.8 |
410.9 |
3256 |
2690 |
0.4 |
0.7 |
|
KB22-01 No. 17 |
407.8 |
880.3 |
2957 |
2230 |
0.3 |
0.3 |
|
KB22-01 No. 18 |
441.0 |
444.1 |
2957 |
2270 |
0.3 |
0.3 |
|
KB22-01 No. 19 |
514.2 |
517.2 |
2939 |
2280 |
0.3 |
0.4 |
|
KB22-01 No. 20 |
593.4 |
596.5 |
2650 |
1930 |
0.2 |
0.2 |
|
KB22-01 No. 21 |
672.7 |
675.7 |
2834 |
1600 |
0.2 |
0.2 |
|
KB22-01 No. 22 |
745.8 |
748.9 |
3030 |
2090 |
0.3 |
0.4 |
|
KB22-01 No. 23 |
849.5 |
852.5 |
3225 |
2180 |
0.4 |
0.4 |
NA – Not Analysed
Table 3 –
|
Sample No. |
Depth (m) |
Specific Conductivity |
Total Dissolved Solids |
Lithium – Dissolved Concentration |
Lithium – Total Concentration |
|
|
From |
To |
(μS/cm) |
(mg/L) |
(mg/L) |
(mg/L) |
|
|
KB22-02 No. 1 |
365.2 |
368.2 |
1888 |
1227 |
<0.1 |
0.1 |
|
KB22-02 No. 2 |
368.2 |
371.2 |
2009 |
1305 |
0.3 |
2.6 |
|
KB22-02 No. 3 |
377.3 |
380.4 |
1942 |
1262 |
0.2 |
1.2 |
|
KB22-02 No. 4 |
398.7 |
401.7 |
2049 |
1332 |
0.2 |
1.1 |
|
KB22-02 No. 5 |
407.8 |
410.9 |
2132 |
1386 |
0.2 |
1.0 |
|
KB22-02 No. 6 |
420.0 |
423.1 |
2176 |
1414 |
0.3 |
1.1 |
|
KB22-02 No. 7 |
453.5 |
456.6 |
2261 |
1470 |
0.3 |
1.2 |
|
KB22-02 No. 8 |
465.7 |
468.8 |
2321 |
1509 |
0.3 |
1.4 |
|
KB22-02 No. 9 |
481.0 |
484.0 |
2470 |
1605 |
0.3 |
2.4 |
|
KB22-02 No. 10 |
496.2 |
499.3 |
2665 |
1732 |
0.2 |
2.2 |
|
KB22-02 No. 11 |
517.6 |
520.6 |
3074 |
1998 |
0.4 |
5.3 |
|
KB22-02 No. 12 |
526.7 |
529.7 |
3200 |
2080 |
0.3 |
10.5 |
|
KB22-02 No. 13 |
548.0 |
551.1 |
3306 |
2149 |
0.3 |
27.0 |
|
KB22-02 No. 14 |
563.3 |
565.4 |
3384 |
2199 |
0.3 |
10.9 |
|
KB22-02 No. 15 |
612.0 |
615.1 |
3656 |
2377 |
0.4 |
0.6 |
|
KB22-02 No. 16 |
618.1 |
621.2 |
3618 |
2351 |
0.3 |
0.6 |
|
KB22-02 No. 17 |
627.3 |
630.3 |
3648 |
2371 |
0.4 |
0.6 |
|
KB22-02 No. 18 |
639.5 |
642.5 |
3238 |
2104 |
0.3 |
0.6 |
|
KB22-02 No. 19 |
642.5 |
645.6 |
3431 |
2230 |
0.4 |
0.6 |
|
KB22-02 No. 20 |
685.2 |
705.3 |
3063 |
1991 |
0.3 |
0.5 |
|
KB22-02 No. 21 |
685.2 |
688.2 |
3083 |
2004 |
0.3 |
0.5 |
|
KB22-02 No. 22 |
706.5 |
797.1 |
2866 |
1862 |
0.4 |
0.9 |
|
KB22-02 No. 23 |
709.6 |
712.6 |
3136 |
2039 |
0.4 |
0.5 |
|
KB22-02 No. 24 |
755.3 |
797.1 |
2847 |
1851 |
0.4 |
< 0.1 |
|
KB22-02 No. 25 |
762.0 |
765.0 |
NA |
26600 |
16.6 |
16.7 |
|
KB22-02 No. 26 |
762.0 |
765.0 |
NA |
NA |
NA |
33.5 |
|
KB22-02 No. 27 |
817.5 |
835.1 |
2946 |
1915 |
0.6 |
0.5 |
|
KB22-02 No. 28 |
832.7 |
854.3 |
3007.5 |
1955 |
0.5 |
0.5 |
|
KB22-02 No. 29 |
854.7 |
915.6 |
2877.1 |
1881.7 |
0.6 |
0.6 |
NA – Not Analysed
About the Kibby Lithium Project
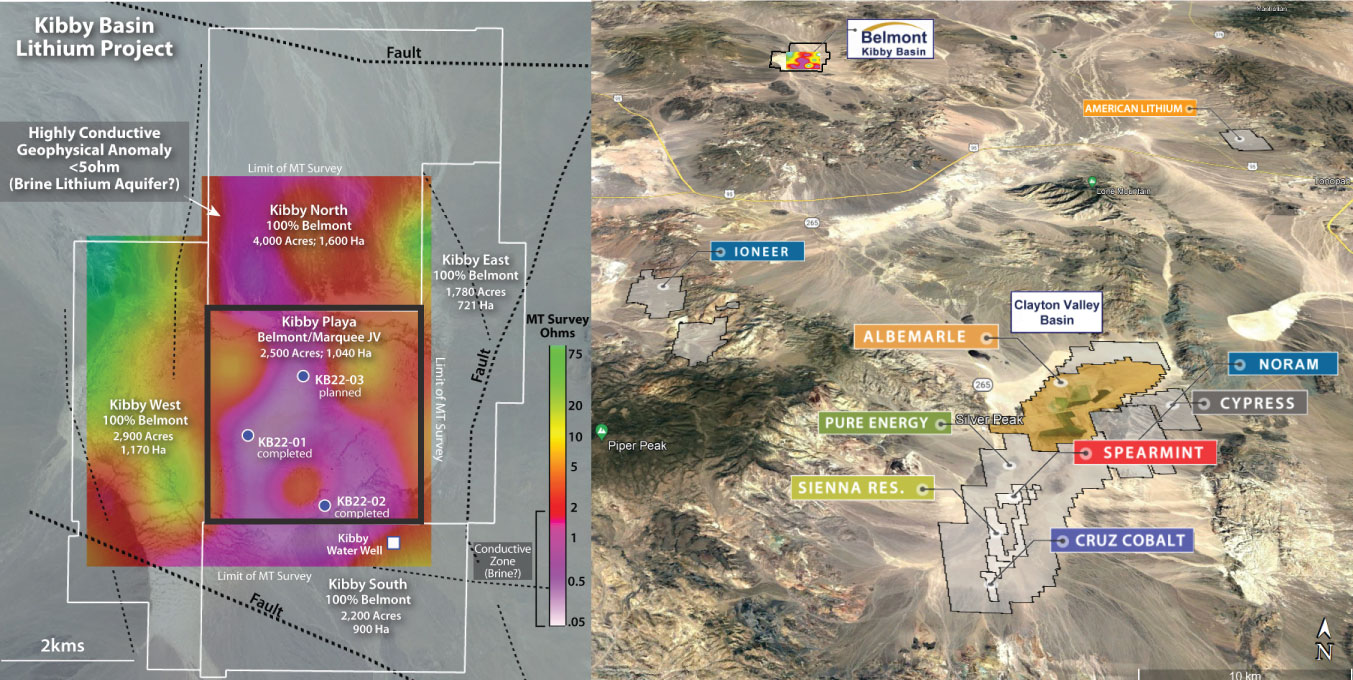
Kibby Basin is located within the Basin and Range Province in southern Nevada. It is a closed-basin that is fault-bounded on the East, North and South.
The Kibby potential deposit type is a continental, mineral-enriched brine aquifer within a hydrographically closed basin (endorheic basin). Continental brines are the primary source for lithium products worldwide. Bradley and others (2013) noted that “all producing lithium brine deposits share a number of first-order characteristics: (1) arid climate; (2) closed basin containing a playa or salar; (3) tectonically driven subsidence; (4) associated igneous or geothermal activity; (5) suitable lithium source-rocks; (6) one or more adequate aquifers; and (7) sufficient time to concentrate a brine.
Kibby Basin Lithium Claims Water Rights
Belmont holds legal water rights with the Monte Cristo hydrologic basin where the Kibby Basin lithium property, is situated. Belmont is fully permitted by the state of Nevada to extract a maximum 2,896 acre-feet (944 million gallons) annually of water for brine processing and production of lithium compounds,
a pre-requisite for the exploration and development of lithium brine projects in Nevada. Under State of Nevada law, water (including lithium brines) cannot be pumped from a subterranean source without valid water rights and permits.
Obtaining a water permit for the Kibby Basin lithium project was a major milestone for Belmont where, because of the desert conditions in the region, water is of major importance to any potential mining operation. The Clayton Valley Basin for instance is over-appropriated (current water rights are in excess of water volumes available for an average year) and obtaining water rights for proposed operations is a hurdle that several companies in the Clayton Valley Basin have yet to overcome, even in their advanced stage of development.
Cypress Development (TSV:CYP) recently paid $3,000,000 for a water permit in Clayton Valley (Cypress NR) which allows for the beneficial use of 1,770 acre/feet (577 million gallons) annually of water for mining, milling and domestic use.
About the Belmont/Marquee option/JV Agreement
In November 2021, Belmont announced an Option/JV agreement with Marquee Resources (ASX.MQR) for the Kibby Playa Block, one of five claim blocks 100% owned by Belmont Resources in the Kibby Basin.
The agreement terms are for Marquee to issue Belmont C$100,000 cash upon signing (completed); issue 3,000,000 Marquee shares (1,000,000 issued); and incur C$2,500,000 in exploration expenditures within 15 months of the signing of the Option Agreement in order to earn up to an 80% interest in the Kibby Playa block.
About Belmont Resources
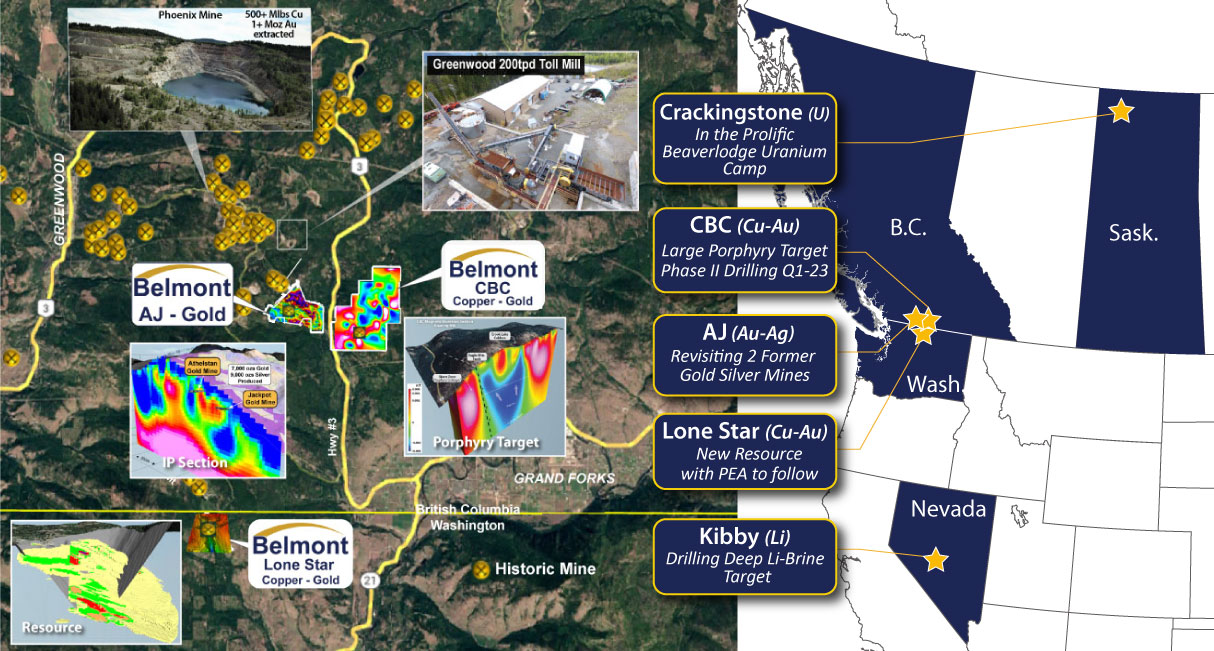
Belmont Resources has assembled a portfolio of highly prospective copper-gold-lithium & uranium projects located in British Columbia, Saskatchewan, Washington and Nevada States. Its holdings include:
-
Come By Chance (CBC): 2021 geophysics delineated potential large copper-gold porphyry
2022 drilling suggest interception of peripheral of porphyry; planned 2023 drilling to target porphyry core. -
Athelstan-Jackpot (AJ): 2 former gold mines with extensive mine dump material grading up to 1oz/t gold; 2023 plan to test gold extraction from dumps using “environmentally friendly” gold recovery system
-
The CrackingstoneUranium: Review of exploration data shows good potential for “Rare Earth Elements – REEs“. 2023 plans to re-assay 2008 drill core for REE’s which was previously only assayed for uranium
-
The Lone StarCopper-Gold: optioned to Australian Marquee Resources ASX:MQR; MQR spending $2.5M in drilling and must produce PEA to earn 80% interest; MQR completed new resource in Dec. 2022 now working on PEA
-
The Kibby Basin Lithium project located 60 kilometers north of the lithium rich Clayton Valley Basin.: Optioned 10% of property to Australian Marquee Resources MQR; MQR spending $2.5M in drilling for potential deep seated lithium brines, to earn 80%. MQR plans to continue drilling in 2023
NI 43-101 Disclosure:
The technical information in this news release has been prepared in accordance with Canadian regulatory requirements as set out in National Instrument 43-101 and has been reviewed and approved by Robert Cuffney, CPG.
ON BEHALF OF THE BOARD OF DIRECTORS
“George Sookochoff”
George Sookochoff, CEO/President
Neither the TSX Venture Exchange nor its Regulation Services Provider (as the term is defined in the policies of the TSX Venture Exchange) accepts responsibility for the adequacy or accuracy of this news release.
This Press Release may contain forward-looking statements that may involve a number of risks and uncertainties, based on assumptions and judgments of management regarding future events or results that may prove to be inaccurate as a result of exploration and other risk factors beyond its control. Actual events or results could differ materially from the Companies forward-looking statements and expectations. These risks and uncertainties include, among other things, that we may not be able to obtain regulatory approval; that we may not be able to raise funds required, that conditions to closing may not be fulfilled and we may not be able to organize and carry out an exploration program in 2023, and other risks associated with being a mineral exploration and development company. These forward-looking statements are made as of the date of this news release and, except as required by applicable laws, the Company assumes no obligation to update these forward-looking statements, or to update the reasons why actual results differed from those projected in the forward-looking statements.